Designing the admin and donor experience for Reforest Trees, from field measurements to donor transparency.
Two platforms on a shared data model: field staff manage every tree's lifecycle, and donors trace exactly which verified trees their money supports.
Overview
The Client
Reforest Trees is a Peru-based reforestation nonprofit restoring the Andean cloud forest and Amazon rainforest, using blockchain to prove every planting is real.
The Task
Design the admin and donor portals from the ground up — starting by establishing a design system to keep two complex platforms consistent.
My Impact
Established the design system, then designed the onboarding flow, donor dashboard, data-entry forms, and tree-info views across both platforms.
Donors invest millions in carbon offsets — but rarely know if their trees survive.
Every year, corporate and individual donors fund global offsets, yet a trust barrier remains: once money is sent, donors can't tell if their trees lived, or if funds were double-counted. We designed the platform that closes that gap.
Problem
Without traceability, even honest impact looks unverifiable.
Working through the PRD with our nonprofit contacts, three core pain points shaped everything we designed.
✦Data silos: Updates scattered across external tools.
Field staff logged initial plantings in OFP, but ongoing ecological updates lived across Tree-Nation, Explorer.land, and others — making project-level tracking inefficient.
✦The mutability vulnerability: Records could be altered.
Initial plantings lived on-chain, but ongoing growth and health logs weren't stored immutably — a theoretical risk of alteration that chipped at credibility.
✦The traceability gap: Donations weren't linked to trees.
Funds were decoupled from physical trees. Donors couldn't tell if their money backed a nursery seedling or an established tree, which risked double-counting.
Our Solution
Admin Dashboard
A mobile-optimized field portal that allows technical/field staff to log tree growth (height, diameter, species-specific biomass) and upload field evidence immutably to the database.
Donor Dashboard
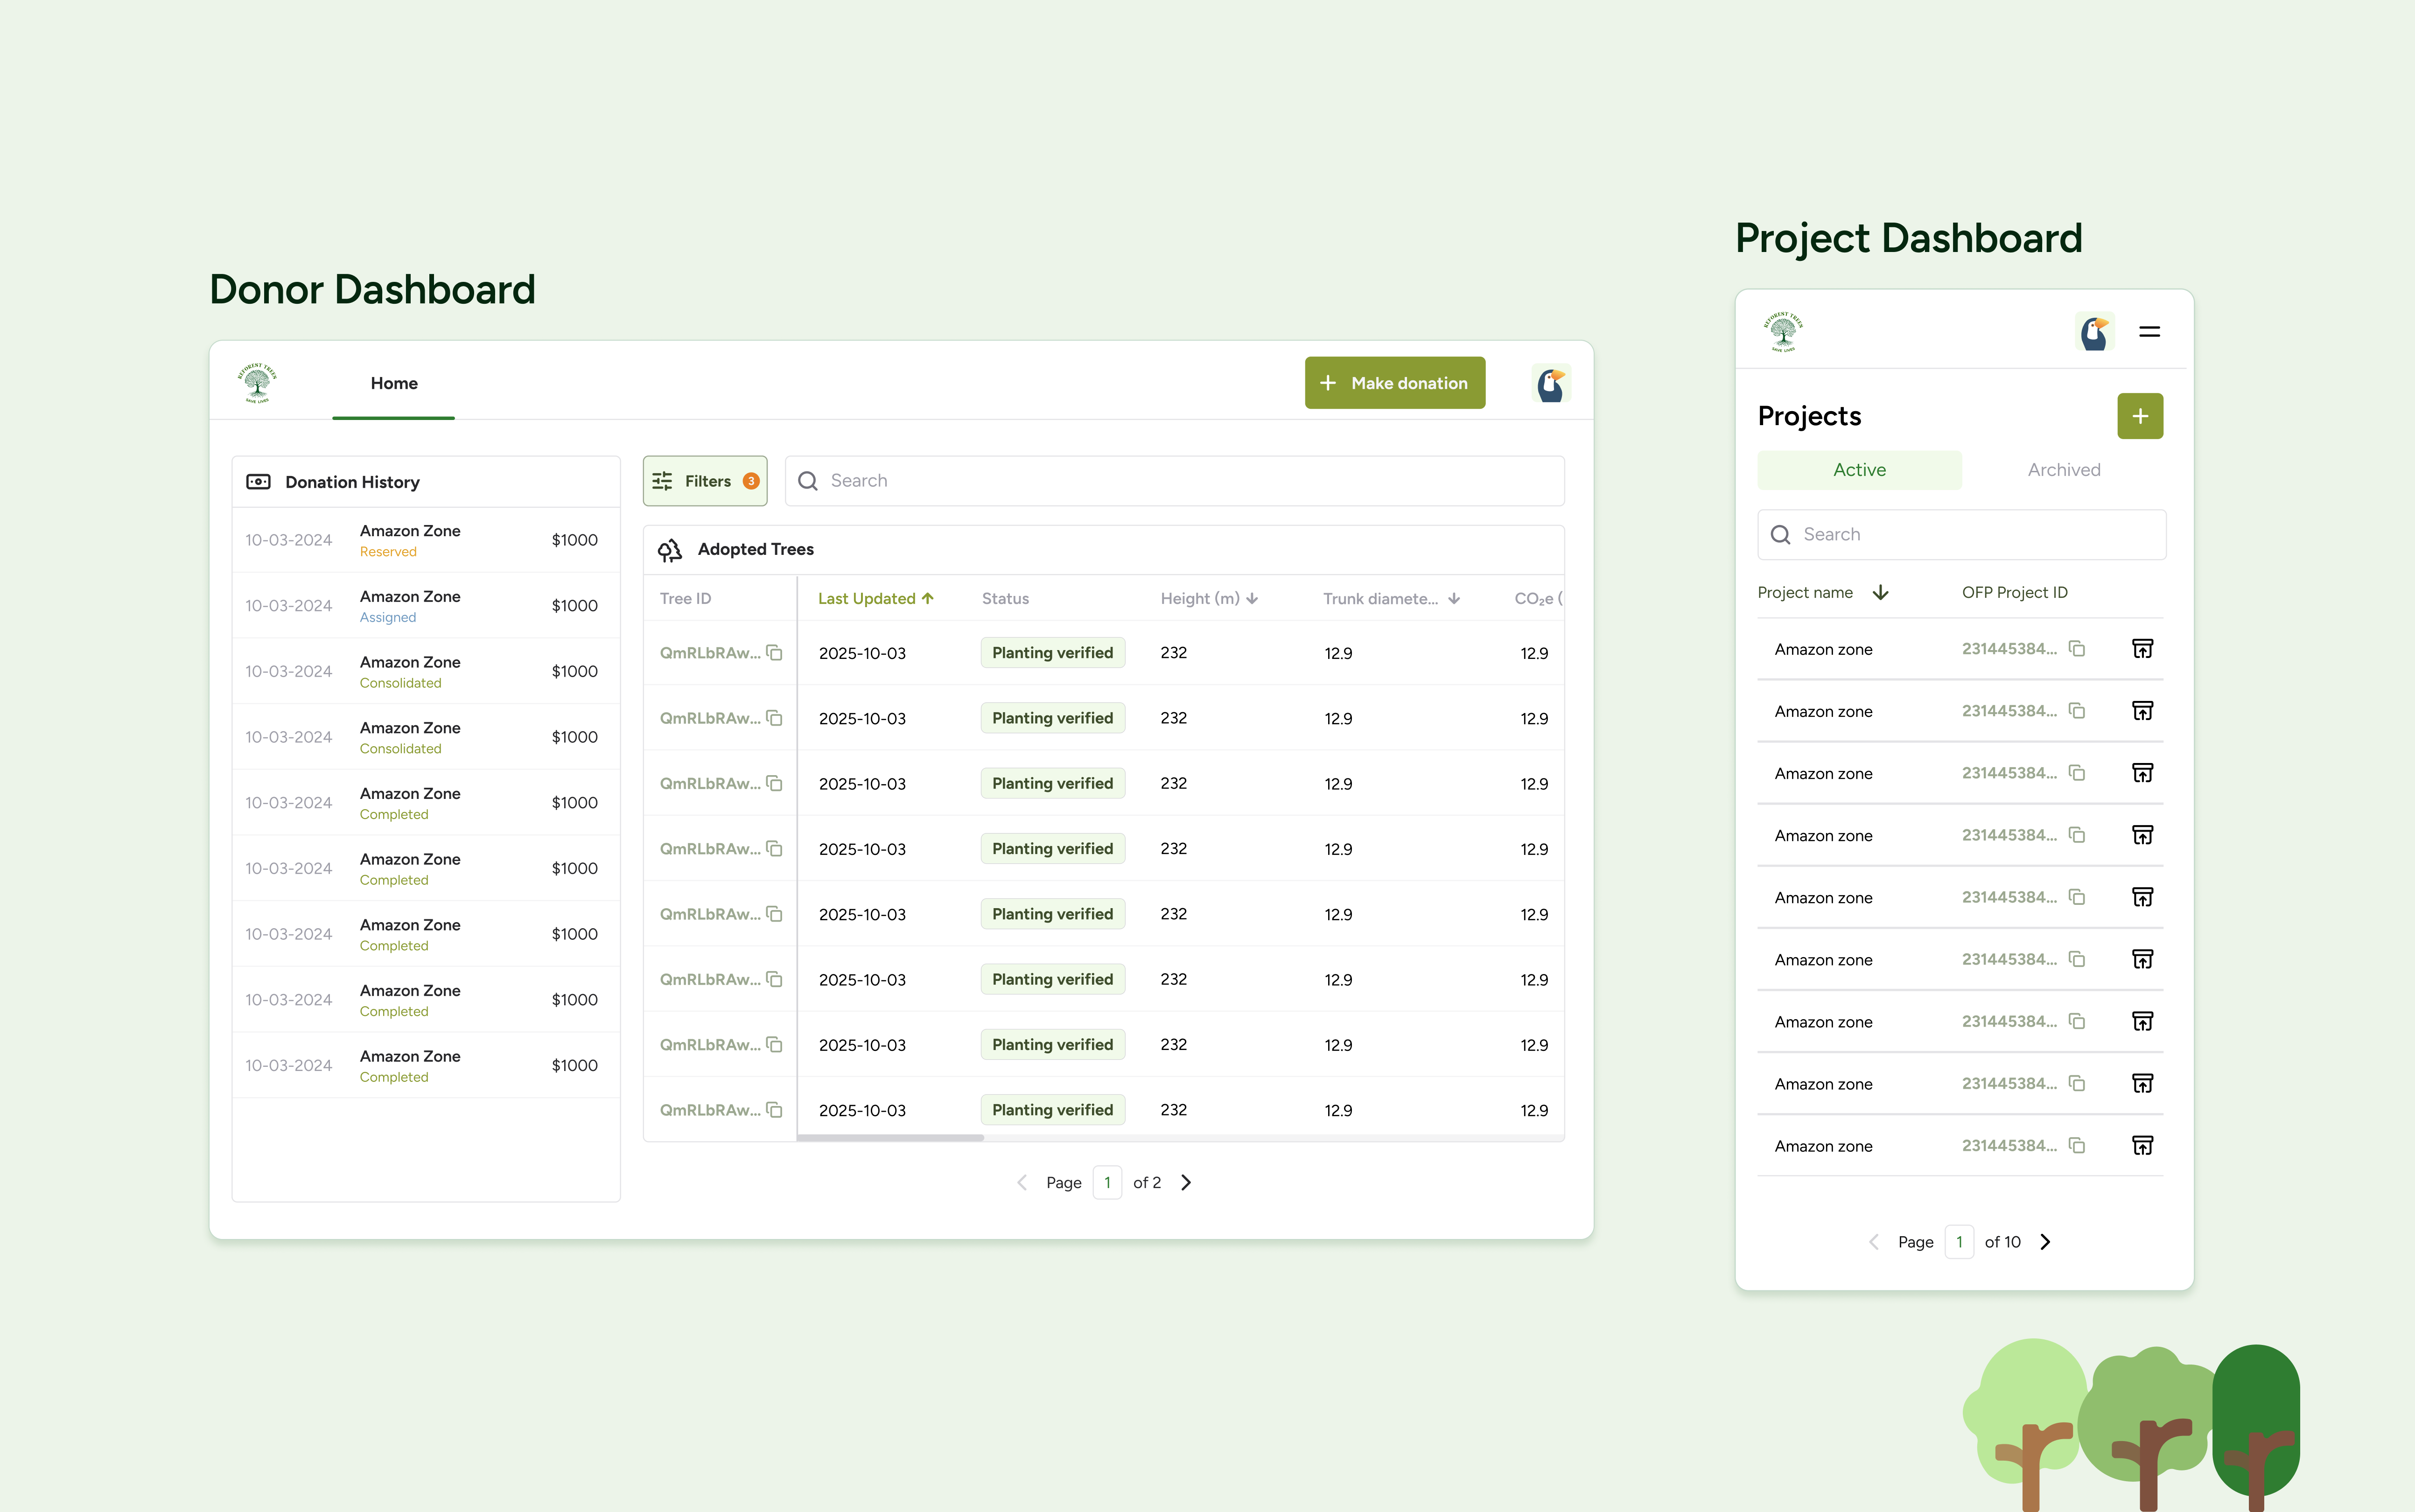
A public-facing portal where donors browse projects, make donations, and track the exact lifecycle, location, and health updates of the individual trees their funds supported.
Research & Goal
Our users are field technicians on tablets and donors who just want proof.
Admins update records on phones and tablets in the field. Donors want transparent impact without learning blockchain or carbon accounting.
✦Goal #1: Make rigorous data entry fast enough for the field.
One update can hold status, GPS, height, diameter, photos, biomass/CO₂e, survival, incidents, and vigor. It had to meet strict carbon-verification standards without becoming a wall of inputs on a phone.
✦Goal #2: Make blockchain-backed proof readable to non-experts.
Not every field technician or donor knows blockchain — yet both rely on the same tree-info view. That shared view had to express the underlying rigor simply: here's the tree, here's how it's growing, here's the proof it's real.
Process
I started by building the design system both platforms would share.
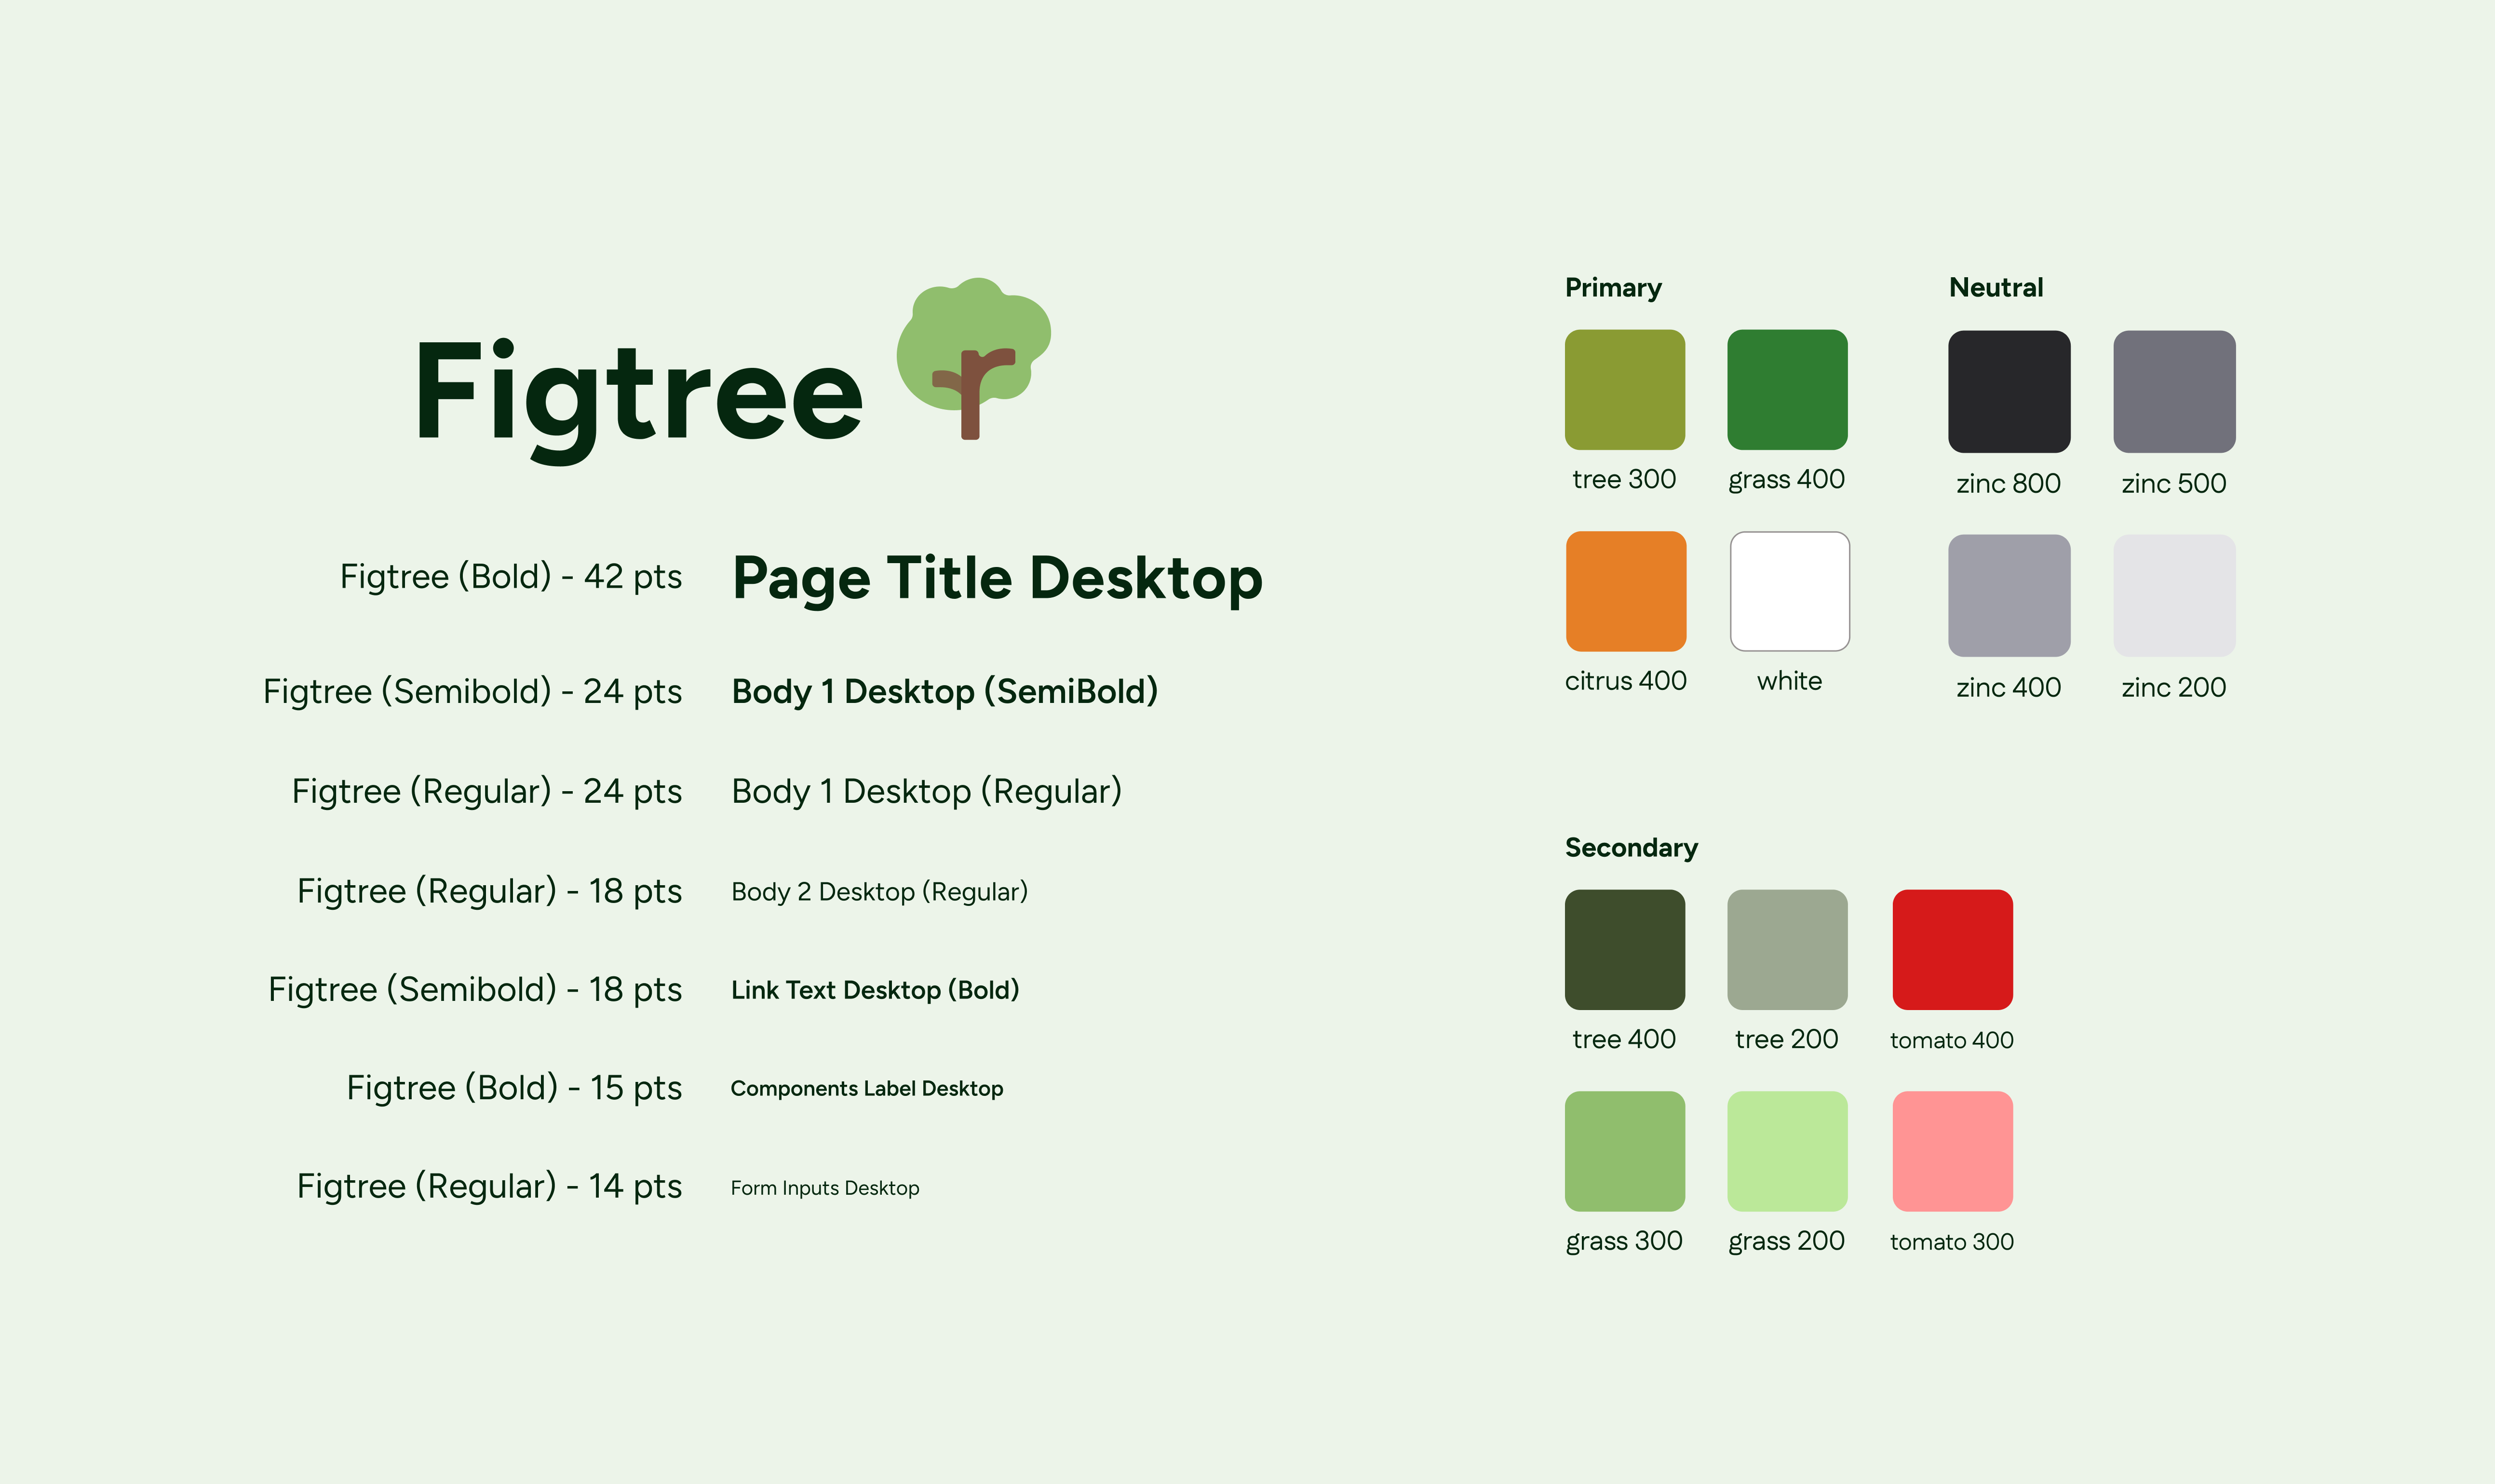
With a five-person dev team building in parallel, I established the foundations first — color, type, and a full component library — so every screen we designed and shipped spoke the same language.
Color
A palette for status, hierarchy, and the brand's earthy identity.
Type
A type scale legible on field tablets and donor desktops alike.
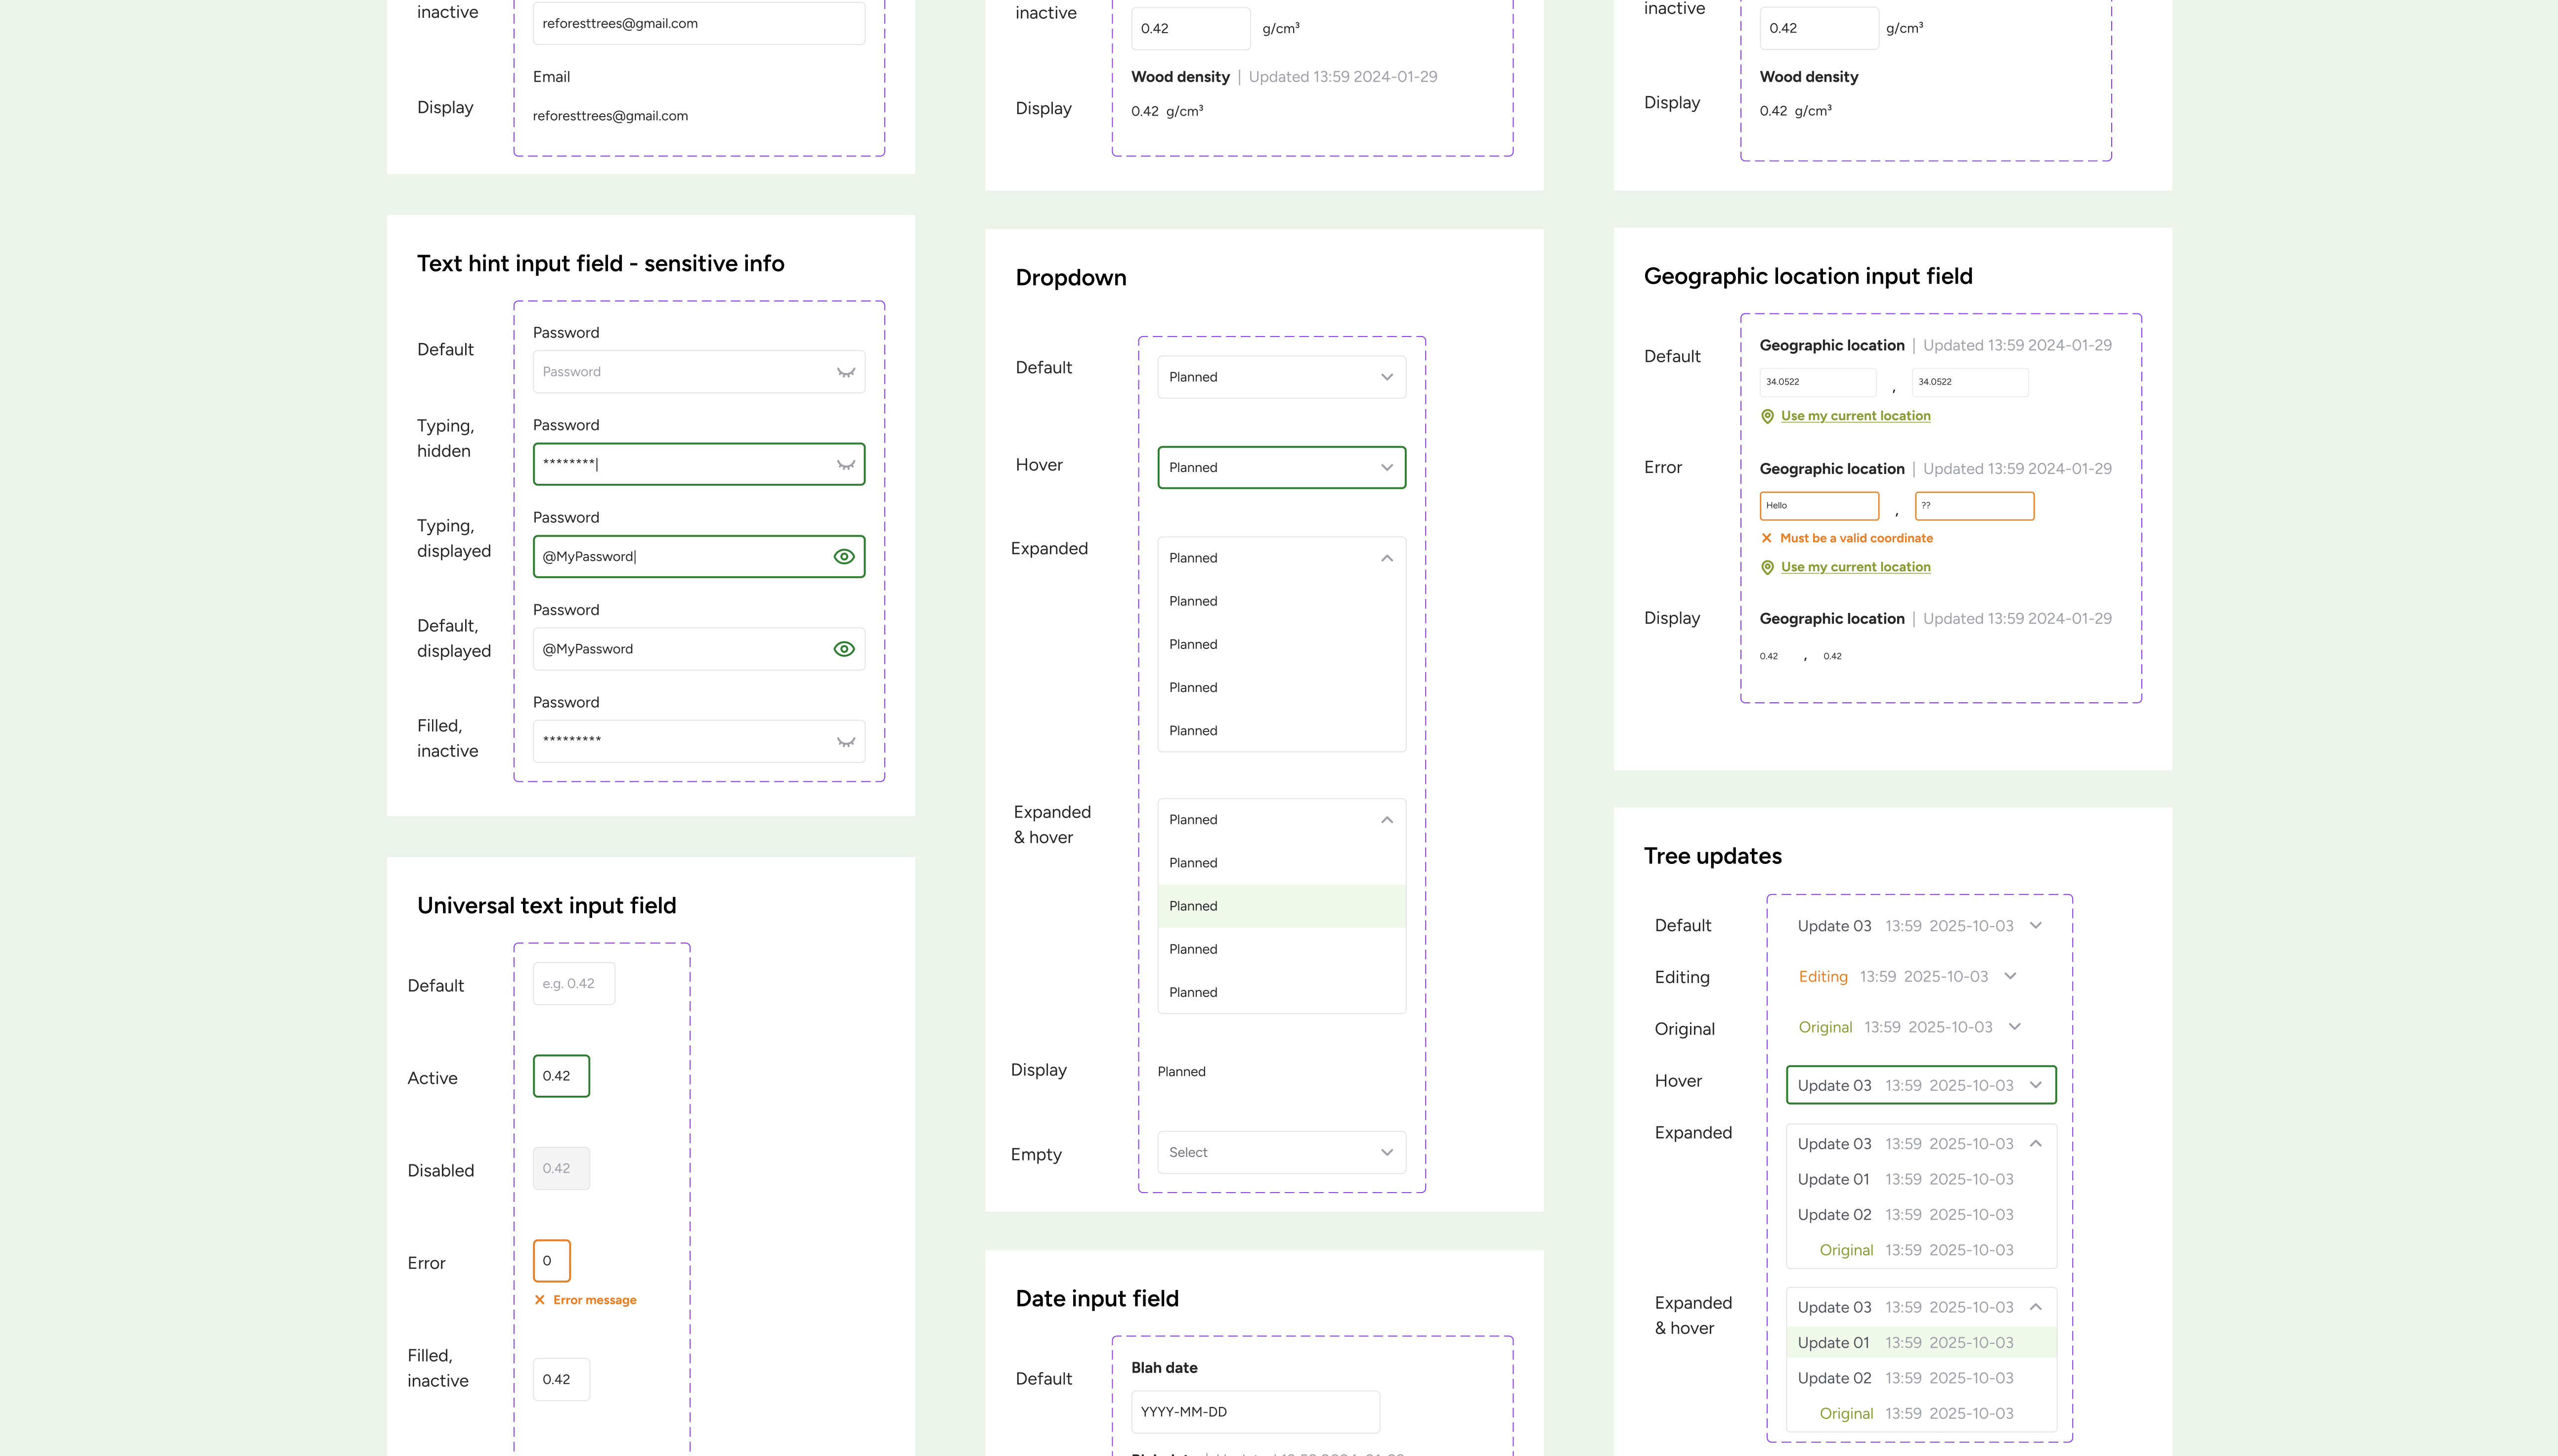
Components
A full form-component library — inputs, dropdowns, uploads, and more.
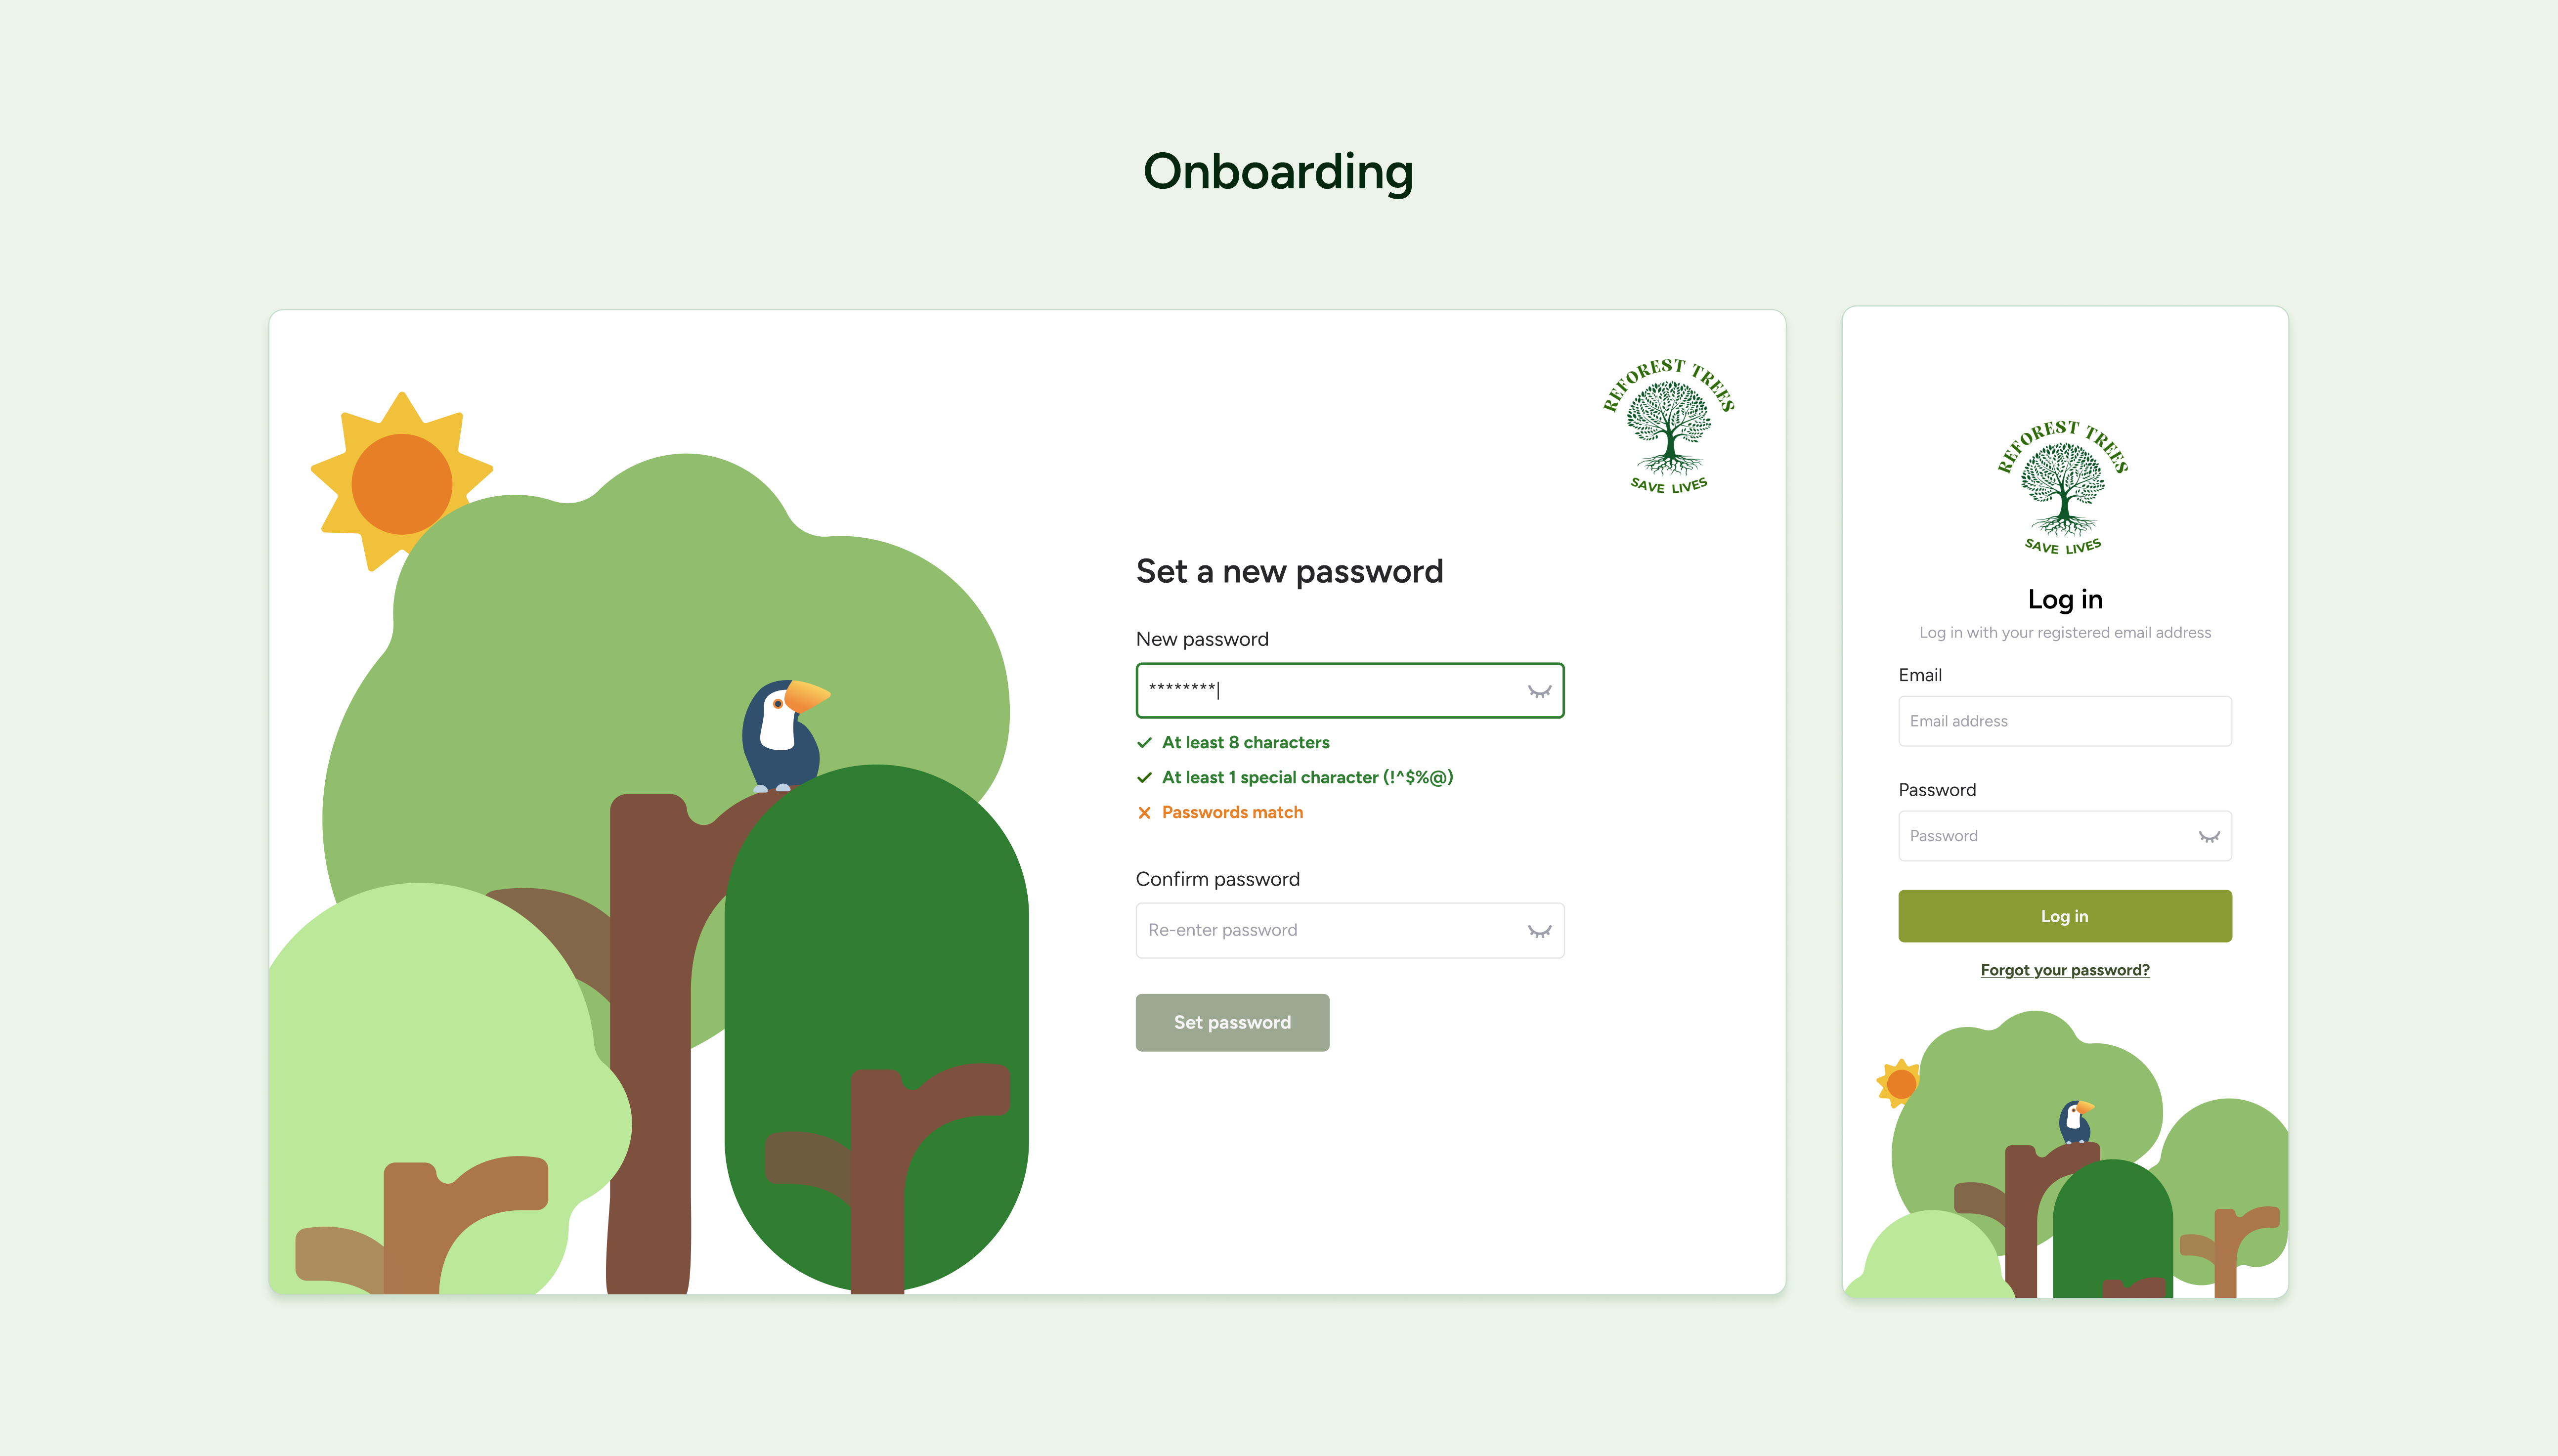
From there, I iterated on the screens themselves — refining layout, language, and flow over several rounds of feedback with our PM, developers, and the nonprofit.
Solution
What we built: two platforms on shared data.
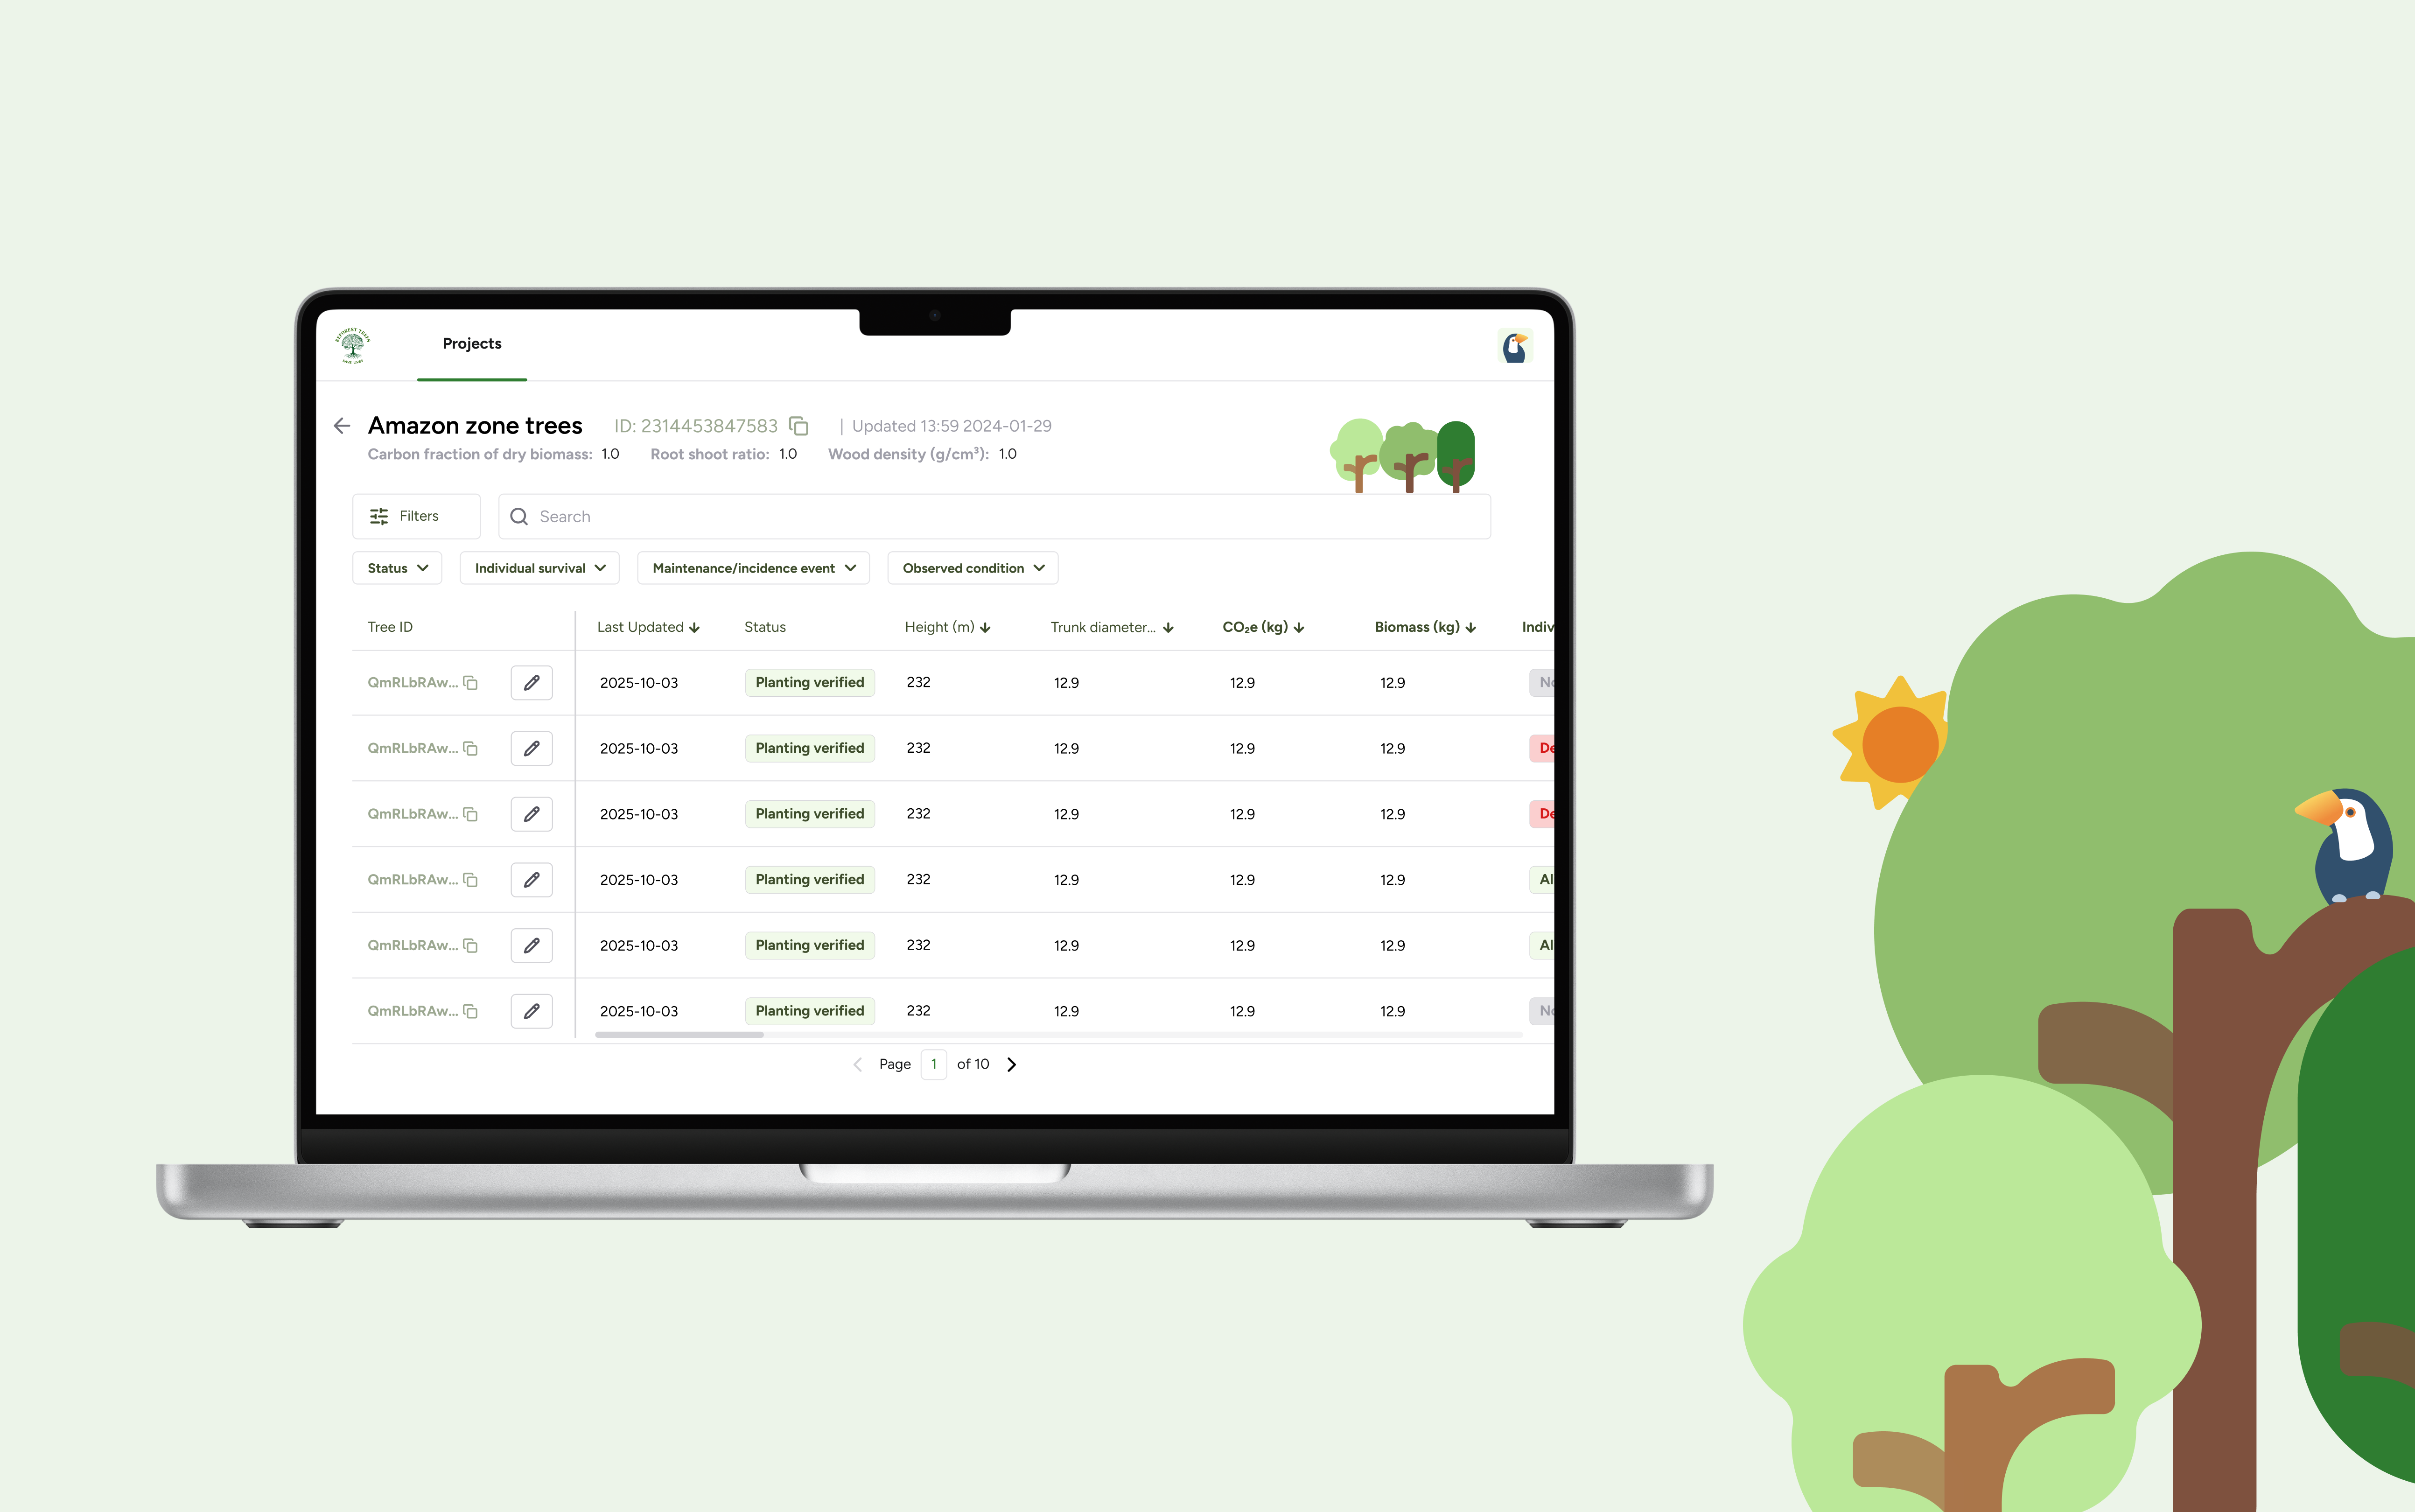
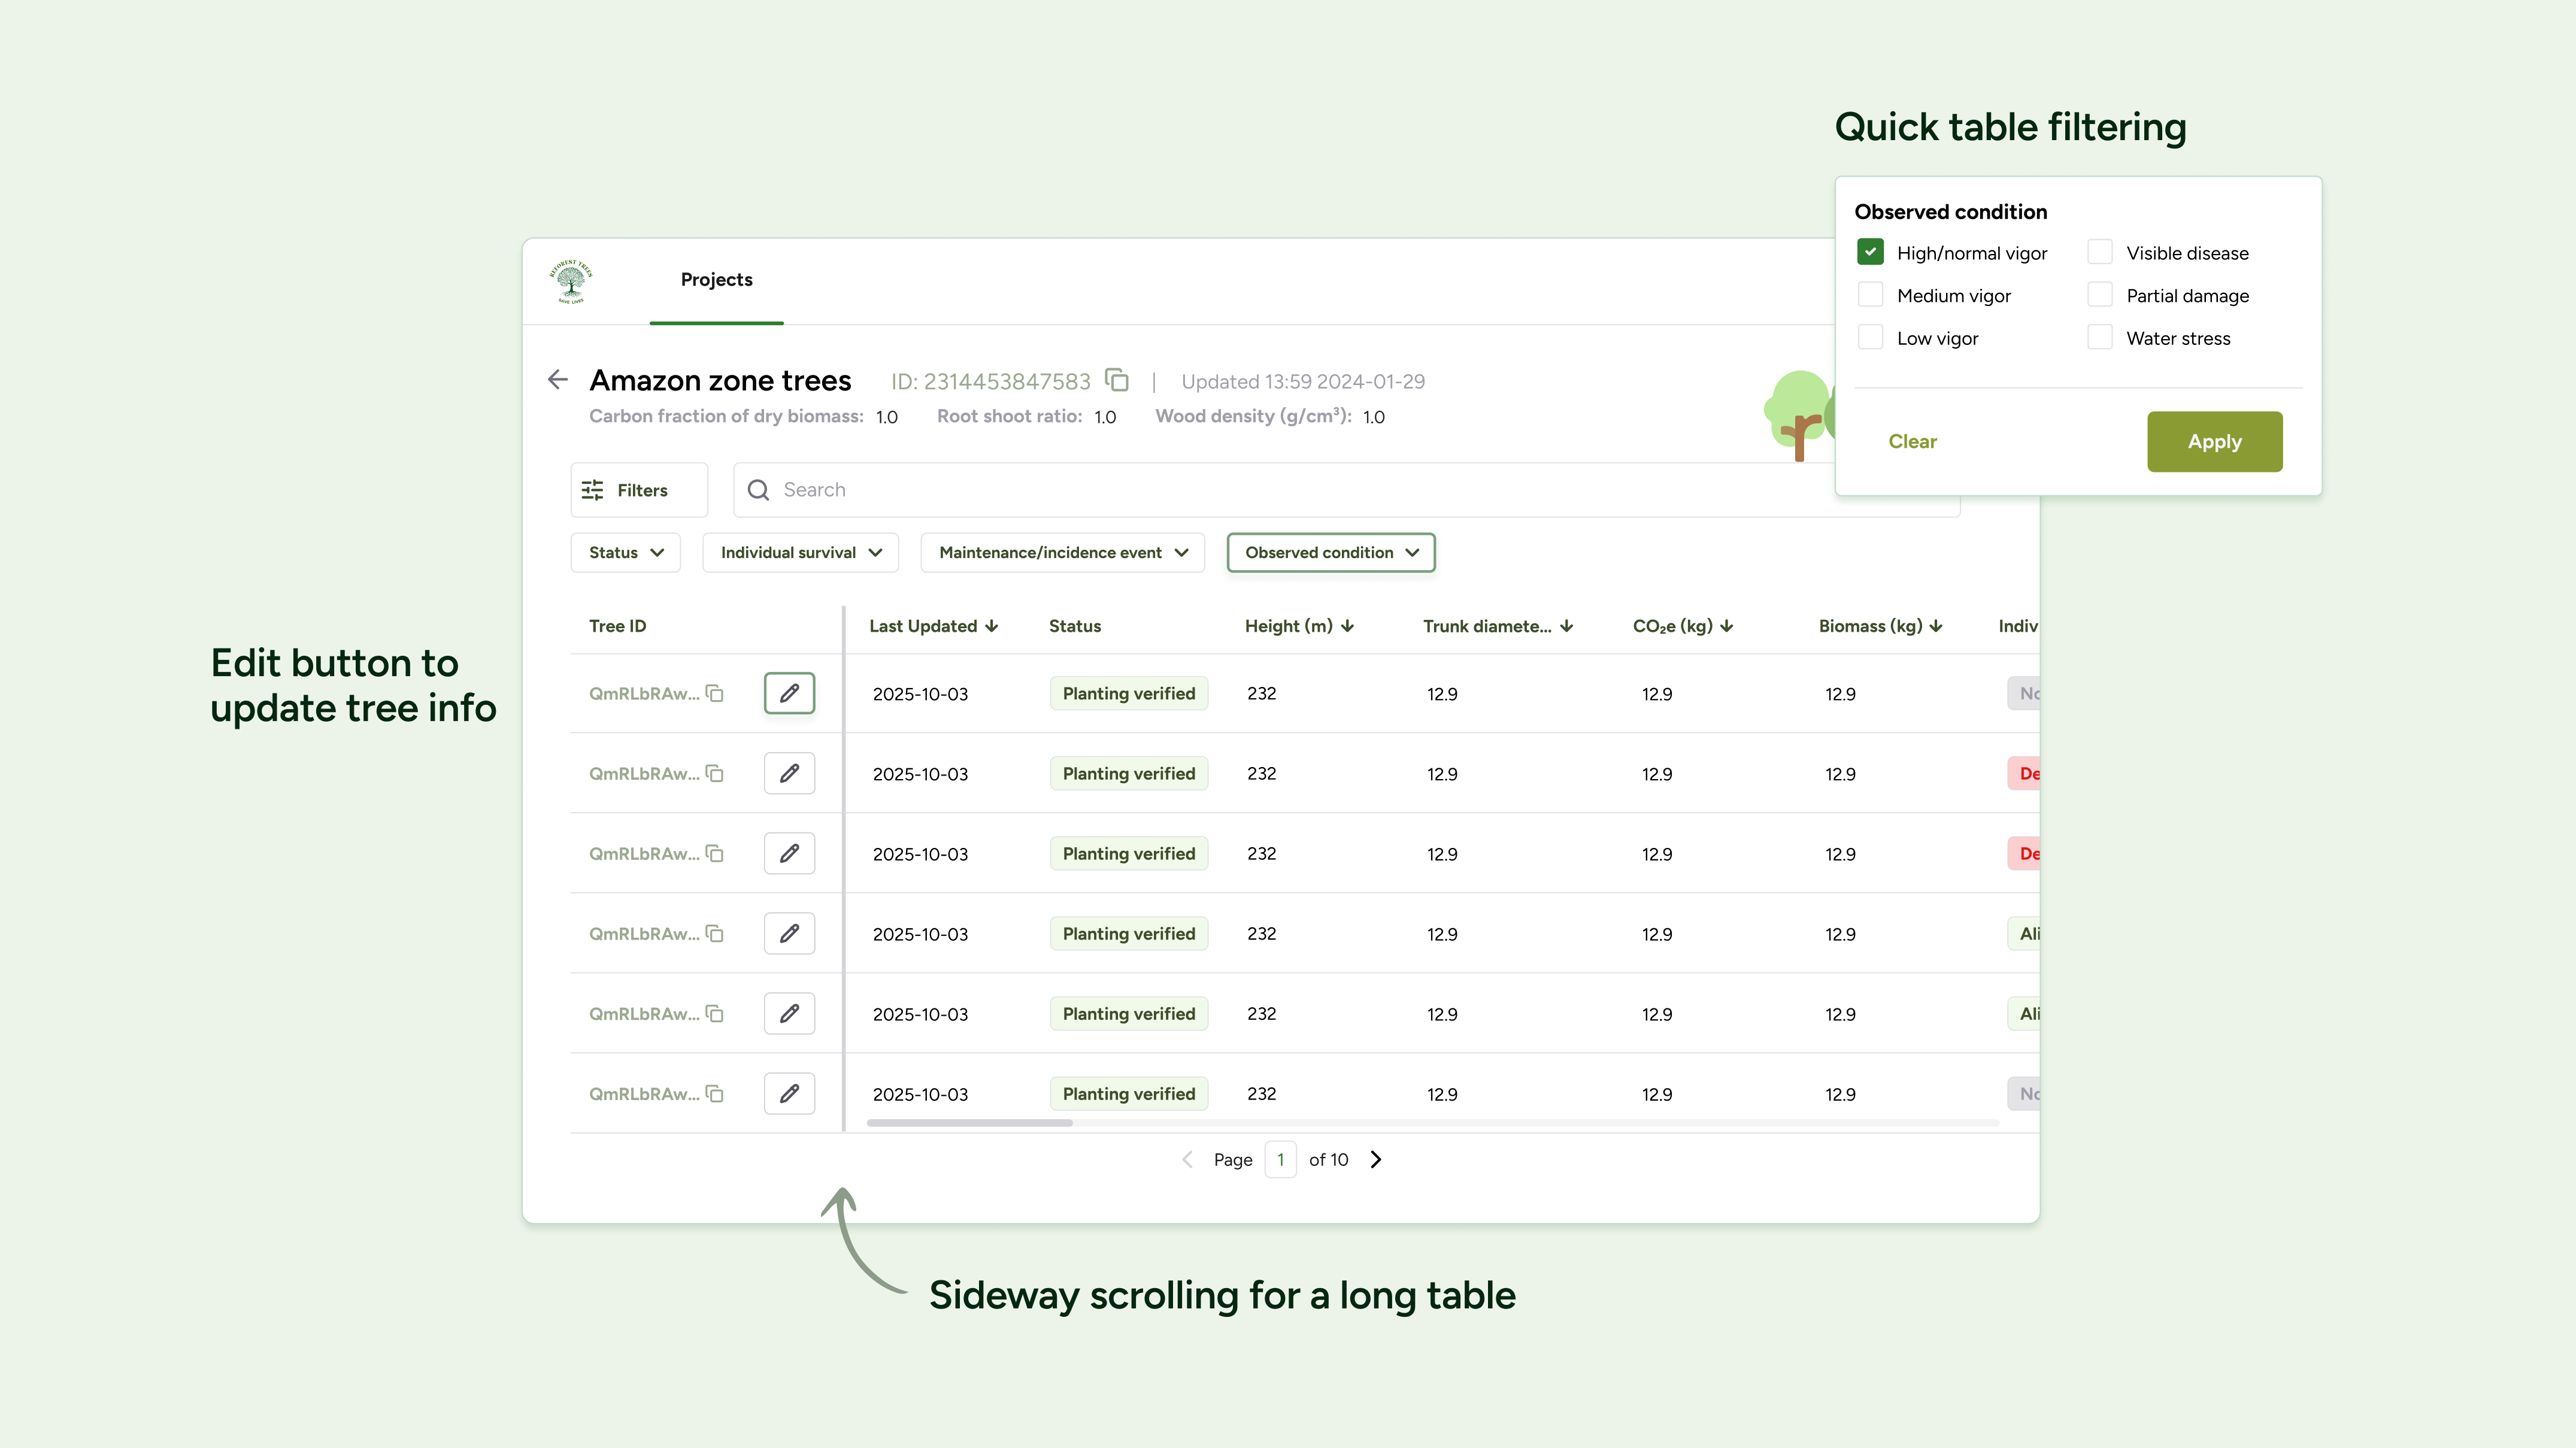
✦Admin Dashboard: Projects and trees, finally in one place.
Admins create projects with species-specific parameters, then search, filter, and sort every tree by status, survival, or measurements. Initial data syncs from OFP; all updates live here.
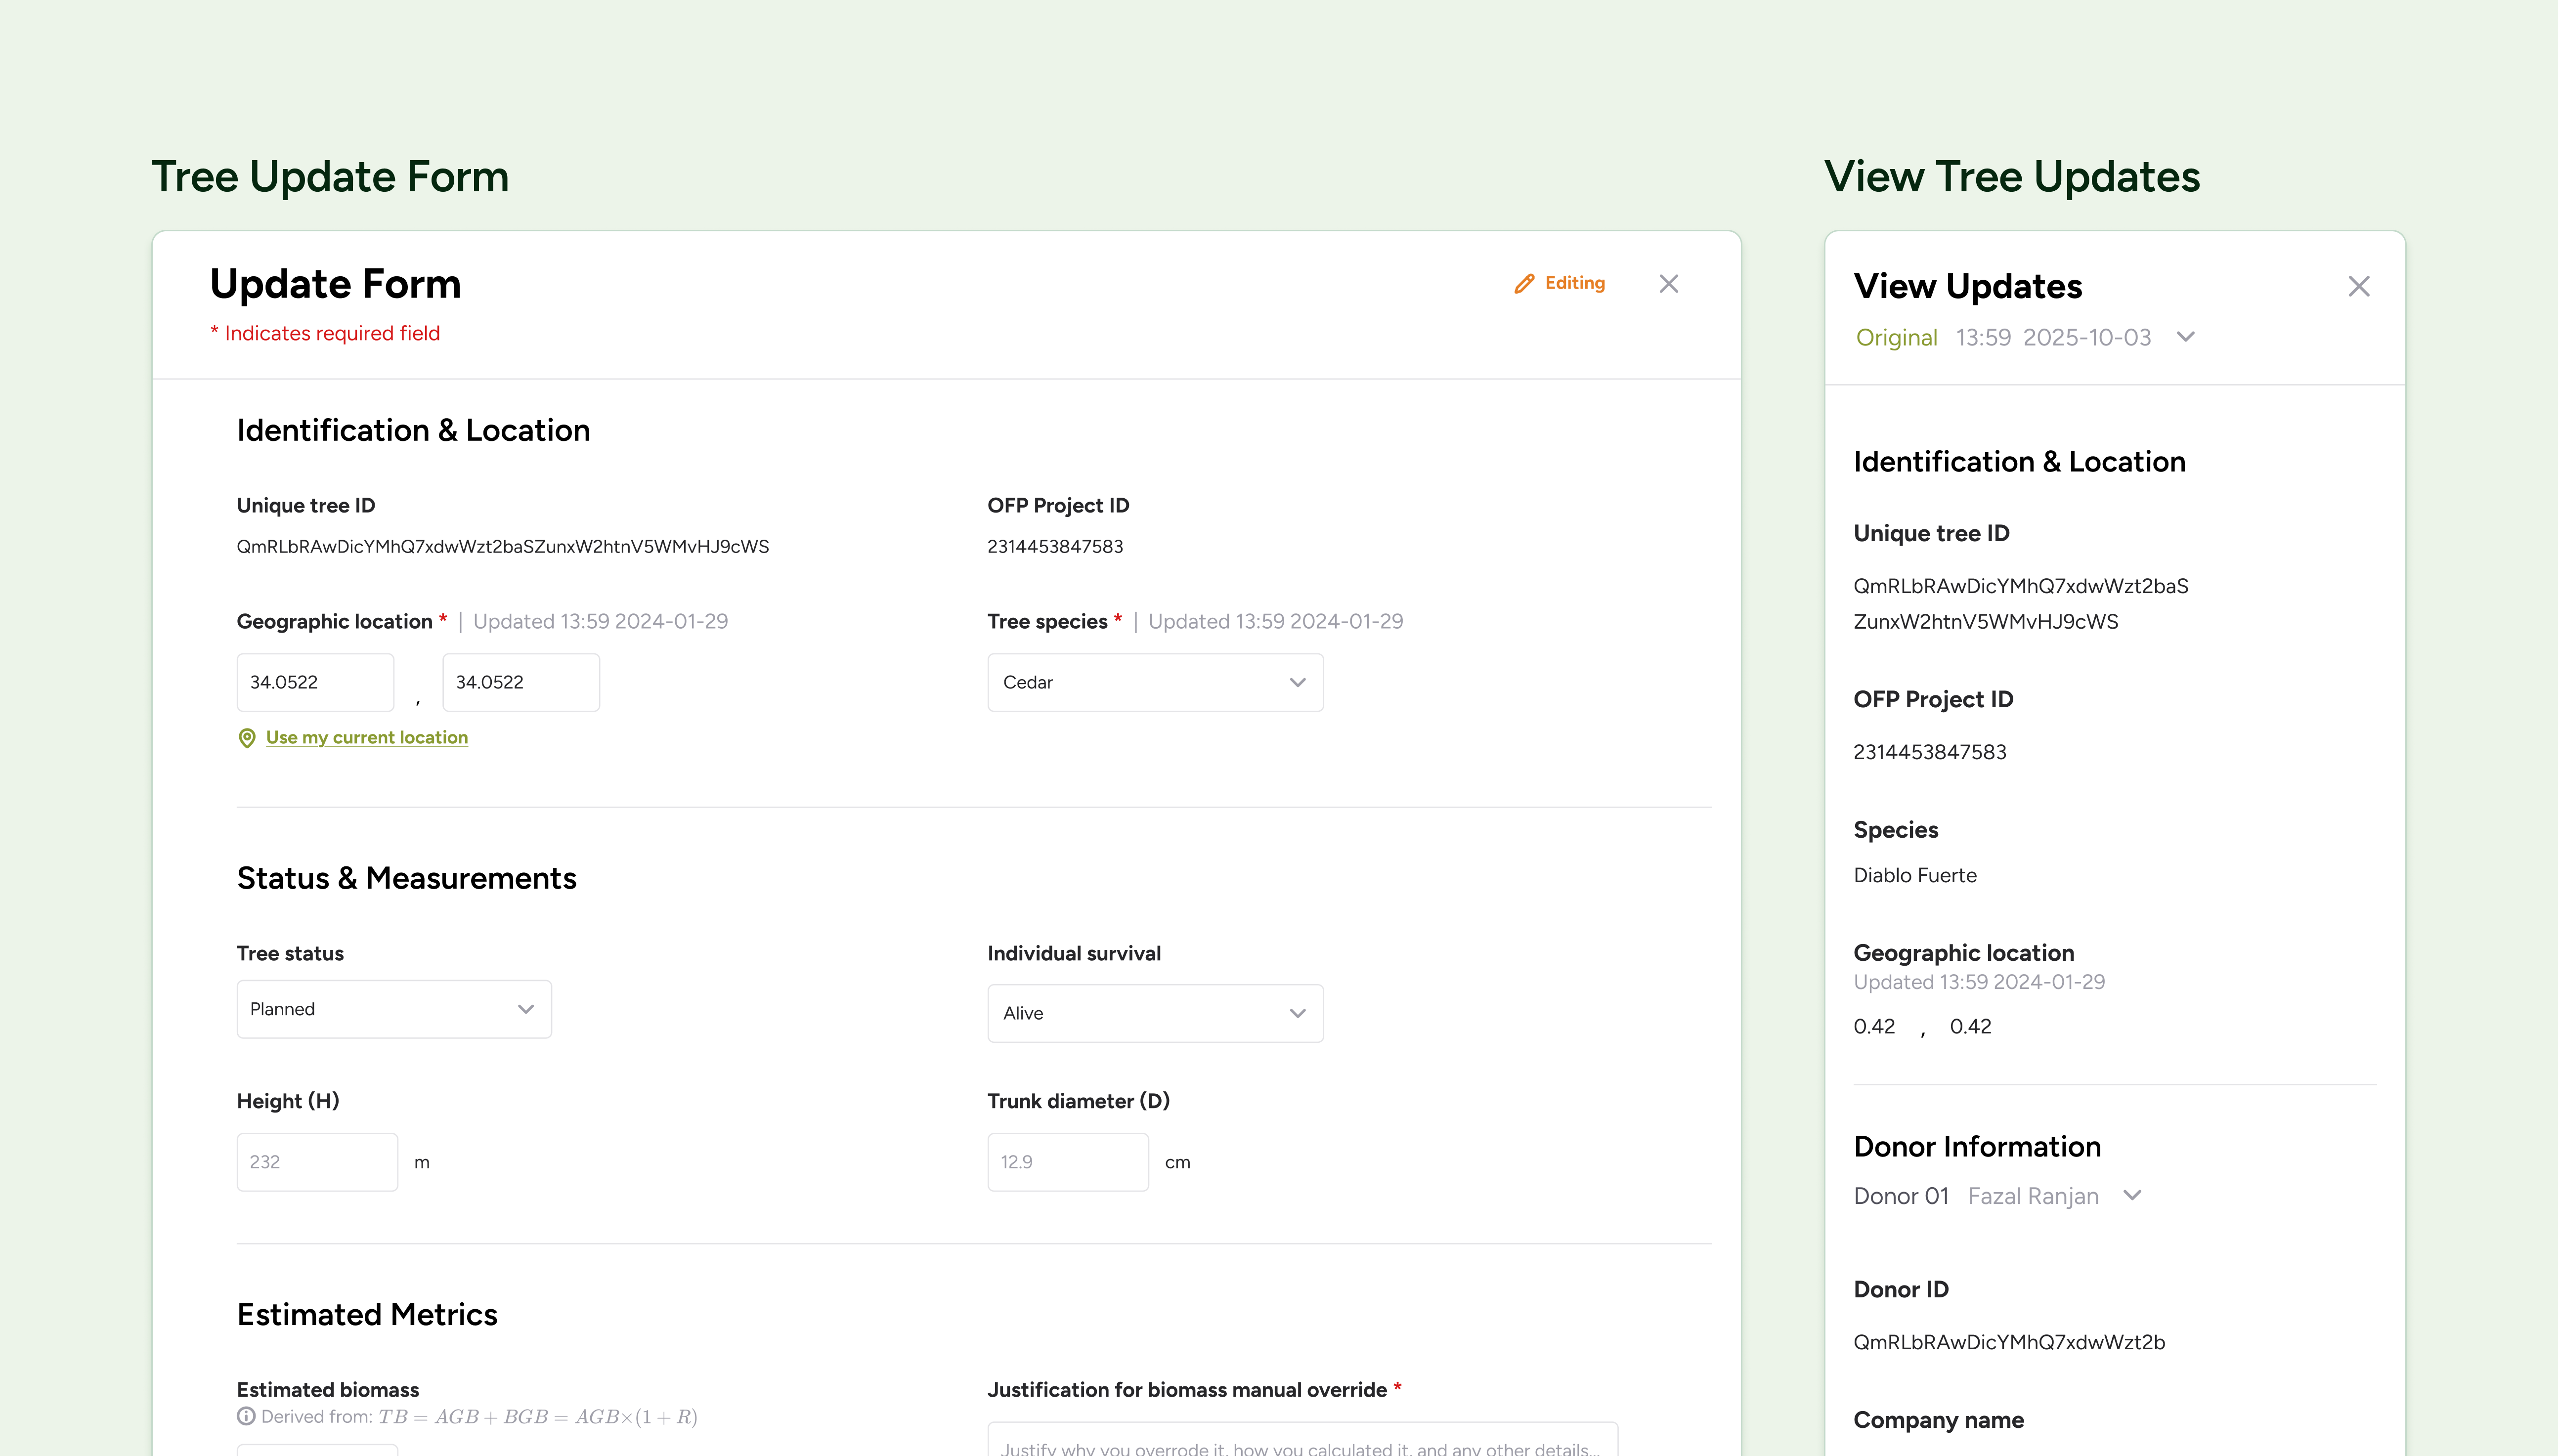
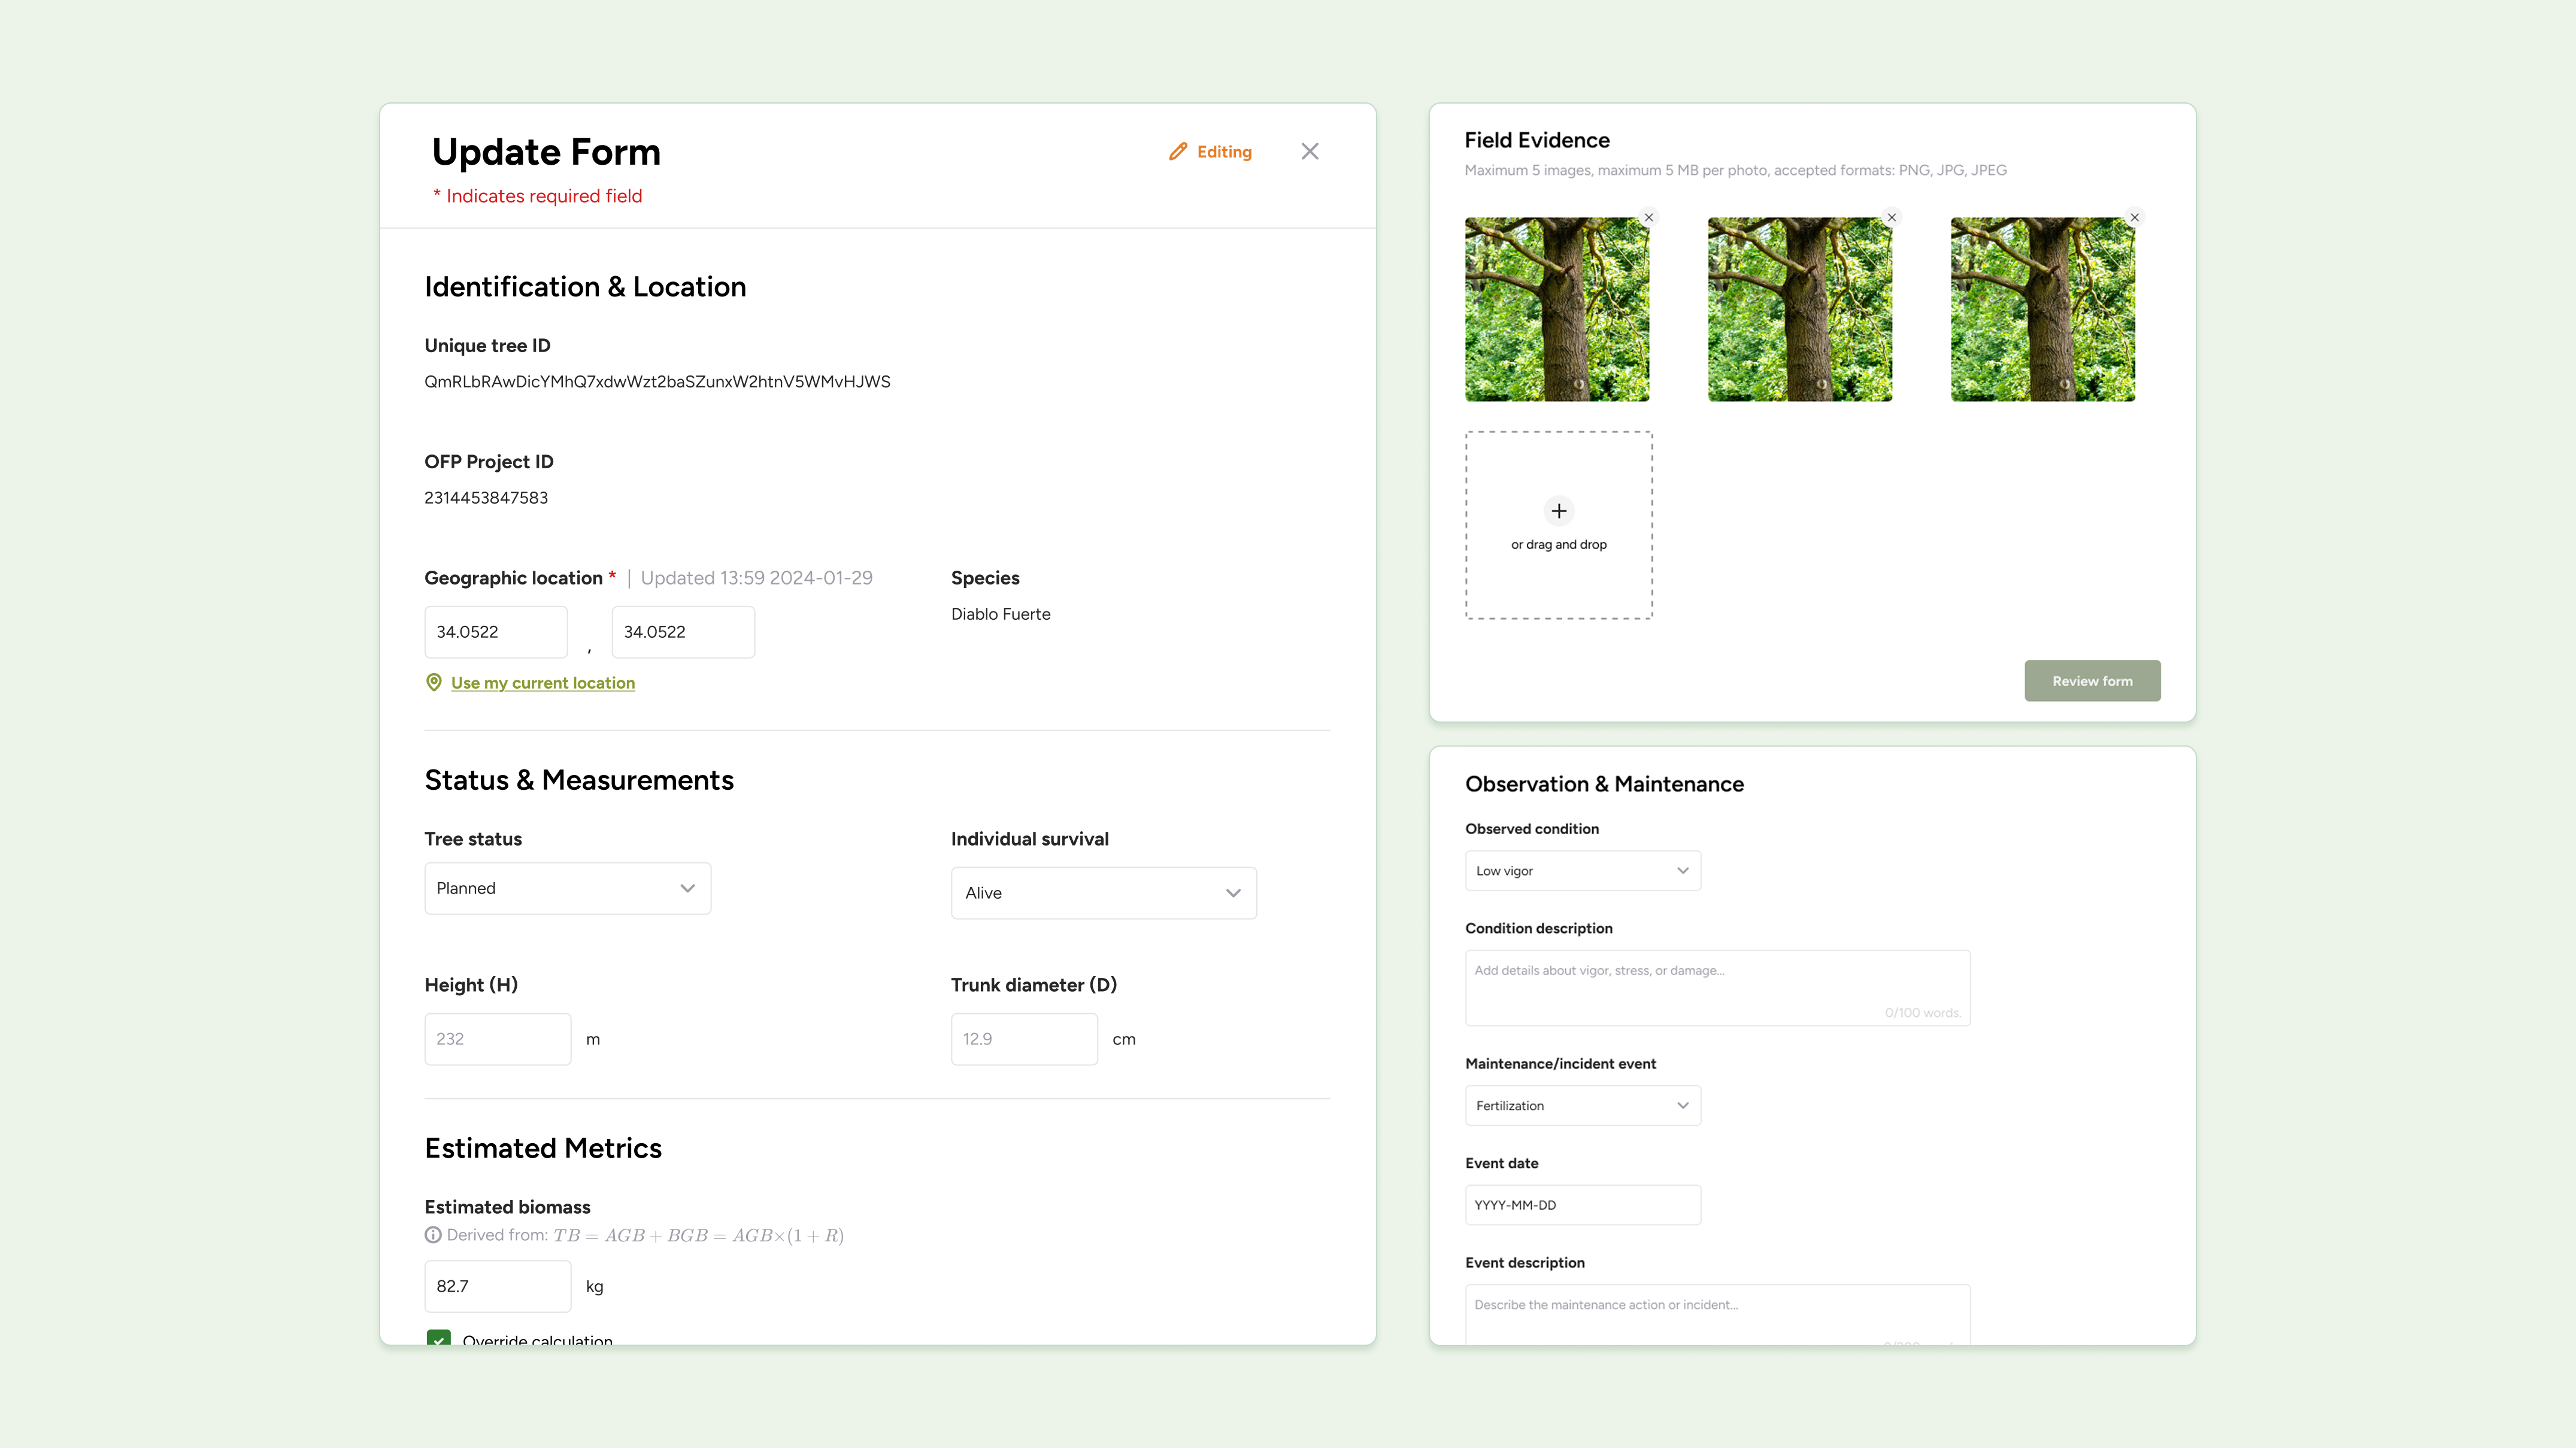
✦Tree Updates: Structured rigor, designed for the field.
Updates capture measurements, photos, incidents, and vigor, with biomass and CO₂e auto-calculated from allometric equations — overridable only with written justification. Grouped into steps that hold up on a field tablet.
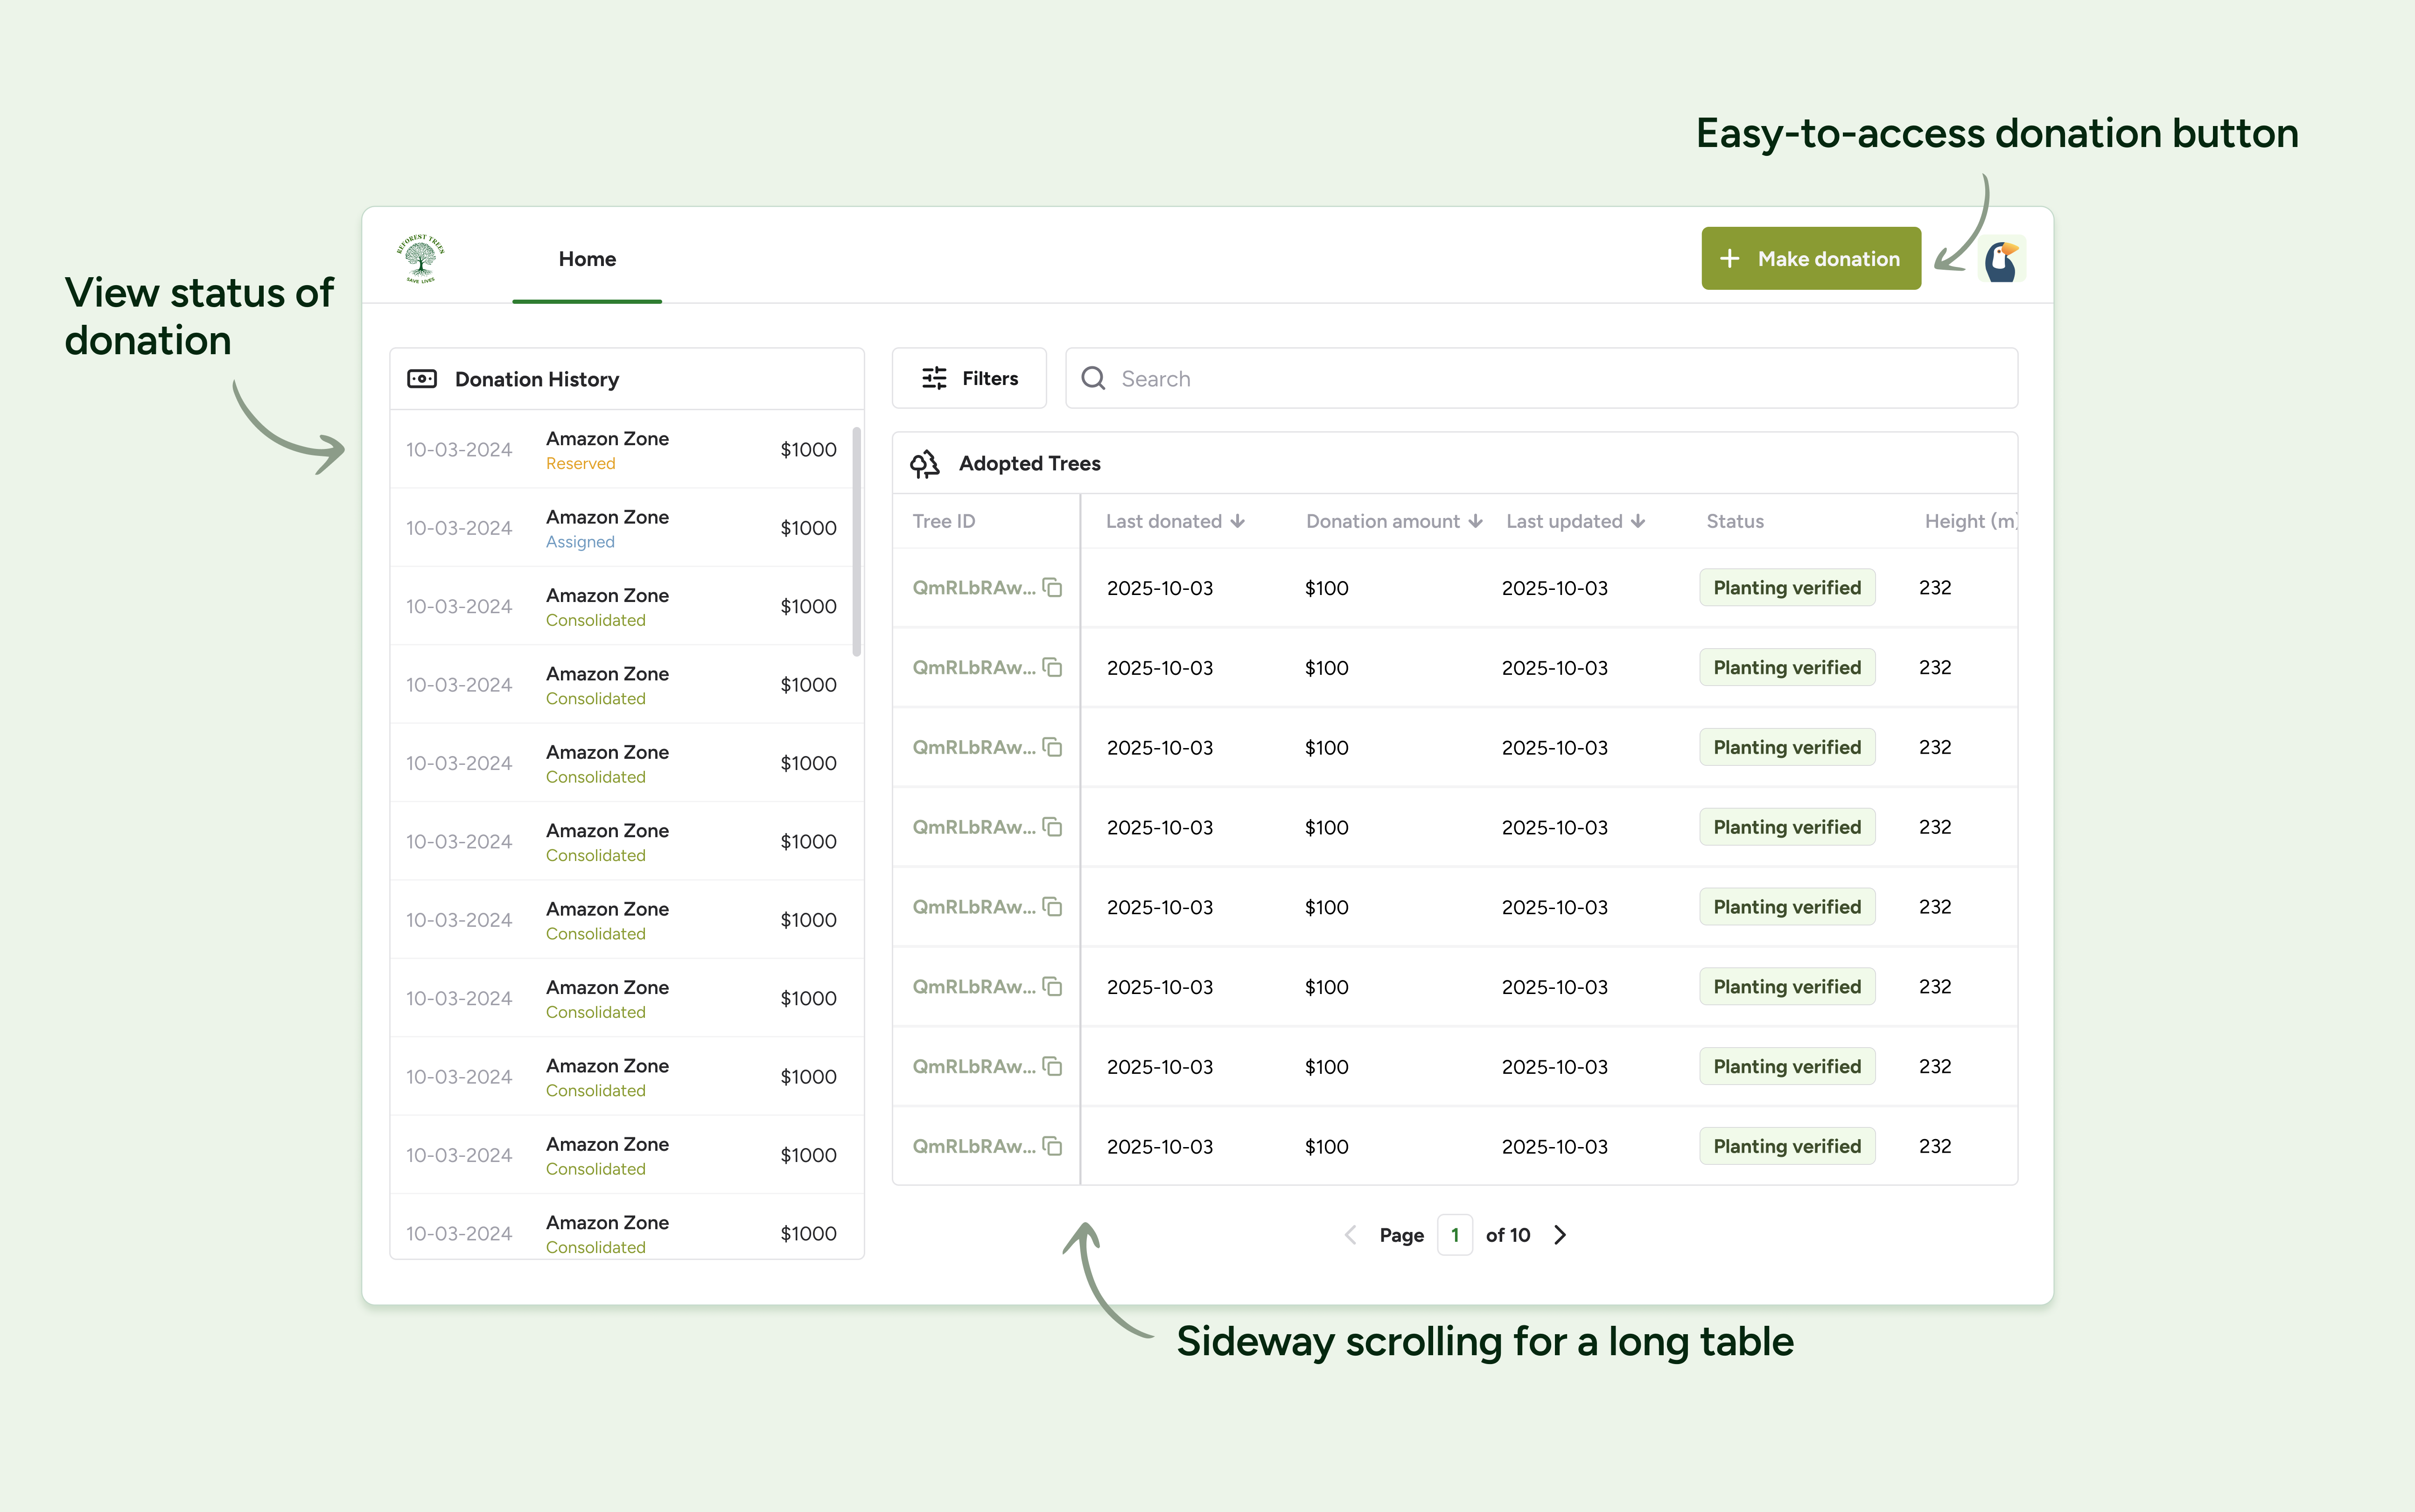
✦Donor Dashboard: Impact you can actually point to.
Donors give in preset amounts and watch allocation status progress. Once consolidated, they open the verified trees they funded — planting data, growth, and contribution, all backed by quarterly on-chain anchoring.
Conclusion
What stuck with me:
✦Complex technical constraints can guide design, not block it.
Carbon-verification standards, allometric equations, and allocation hierarchies sounded intimidating at first. But once I understood why each rule existed, the interface decisions — what to show, what to automate, what to require justification for — became much clearer.
✦One component can serve two very different users.
Admins and donors share the same tree and table views, but need different things from them — control versus reassurance. Designing components flexible enough to do both, without bloating either, was the most valuable constraint of the project.
✦Designing around real-world communication limits.
Our client didn't speak English, and their connection was too unreliable for calls — so every bit of communication happened over email, often translated. I learned to make my designs and rationale clear enough to stand on their own asynchronously, without a live conversation to fall back on.
Thanks for reading! Huge thanks to Reforest Trees, our team, and Hack4Impact UIUC :)